
Storytelling with Analytics: The Perfect Combination
Tuesday March 18th, 2014Storytelling isn’t what it used to be. These days you need to back up your story with data.
Storytelling… Then And Now
In the old days, myths and fables were commonplace. Before telephones, Internet and Reddit, you believed a convincing man on horseback, because you had to. Unless, that is, you had a second witness to confirm or deny it.
Technology, transportation and telecommunications have changed all of that. People expect more than a good story. Remember what happened when you didn’t supply sources when you handed in your book report or college essay? You failed. You can apply the same thinking to marketing. You need to support a story, especially a far-fetched or amazing one, with strong data. Without the data you are as good as the next man or woman spreading myths, riding from town to town on horseback.
What’s In A Great Story?
A great story strikes a chord with the audience. The conflict is troubling and real. There is empathy towards the characters. The tension builds as the audience waits for a resolution. There is a tangible take-away. While the overall story and tone may resonate with your audience and stick in their minds, a statistic is something that can be easily recalled and repeated to others. A nugget of good data can encapsulate the whole story and is shareable. It’s often the only thing people see in their social feeds, so it better grab them and drive them to click on the link to your article, case study or website.
Next time you write a case study or tell a potential customer about a past project, think about how you are telling the story.
-
Are you presenting the conflict or challenge you had to overcome?
-
Are you introducing the characters properly?
-
Are you presenting the story in a human, objective and unfiltered way?
-
Are you introducing details that make the story feel real and relatable?
-
Are you sharing what both you and the client learned from the process?
-
Are you able to present tangible data or metrics to prove the results of your story?
A heartfelt success story is your best weapon in any presentation or sales meeting. Make sure you are weaving in all of the important elements and details. Conflict and imperfection are human, and they go a long way in building trust with your audience.
Are You Presenting The Right Data?
The first question to ask yourself before diving into Google Analytics to find data is: What am I trying to show? Growth in web traffic? Growth in sales? Growth in awareness?
Then, consider how you want to frame it. Are you showing progress over a month? A year? What time period best represents the story you are telling?
Think about what factors you should consider in presenting your data. Do you need to combine multiple data sets? What can you infer from the numbers once you’ve pulled the data set(s)? Do they fall in line with your story?
Finally, figure out the best way to present your data so it supports your story and is both accessible and easy to understand.
I Hit A Roadblock With A Recent Client Case Study
My goal was to show growth for PainCave in terms of brand awareness over a 90-day period. We knew more people were searching for their brand and business, based on a 125% increase in organic traffic to the site using brand-related keywords. However, my team struggled for days trying to find the right way to present the information.
We considered a line graph, which would have been an easy solution, but decided it was too easy.
Then, we tried two scatter-like graphs overlaid on separate maps of the US. That wasn’t quite right, either. It was too much to look at and hard to compare.
Were we overcomplicating it?
I sat down with my team to emphasize the goal of the graph. I explained that to properly show how brand awareness grew over 90 days, the audience should be able to immediately see the difference without taking out a tape measure or caliper.
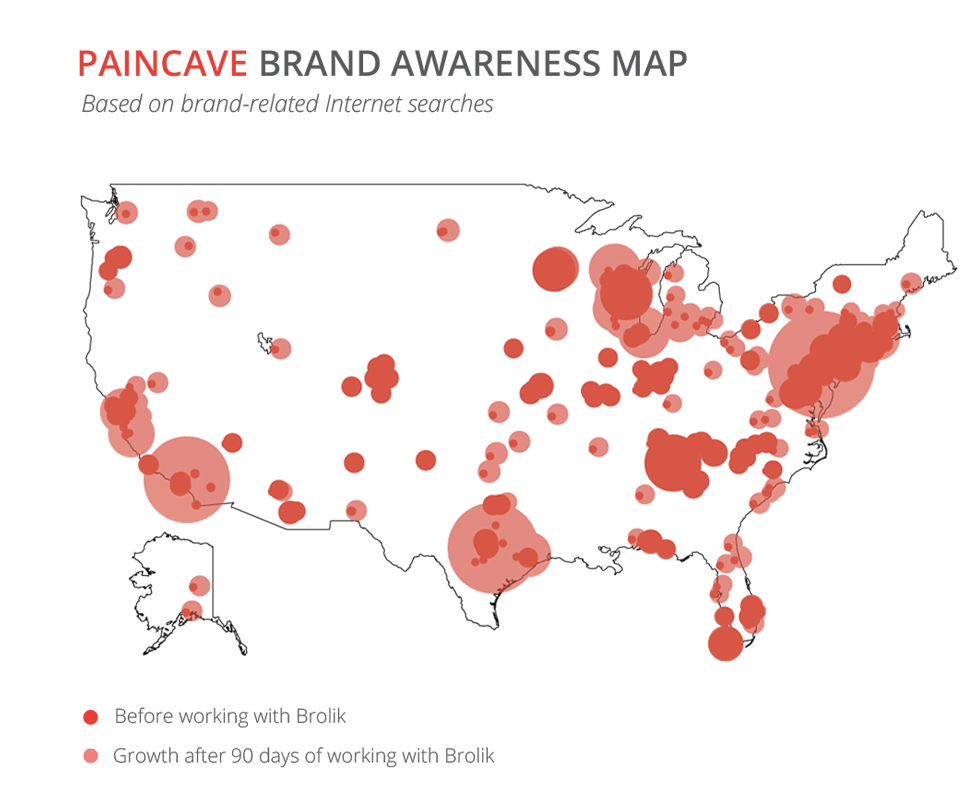
After a few more iterations and a few more days of debating the best solution with our strategists and designers, we finally landed on the right graph to show our data and tell our story.
-The End-
Well, did I follow my own advice in the story above? Were all of the necessary story elements included?
For all of you storytellers out there, keep telling stories. Just consider how you can support stories with data to make them more tangible, powerful and shareable.
For all of you marketers and data-crunchers out there, think about how you can support your team in telling your story or your customer stories more effectively.
You’ll wow your audience with the perfect combination of both.