
In web analytics, uncovering new information that can guide improvements to your web presence is the name of the game.
New information comes from the analysis of data, so it only makes sense that tools giving access to new data or offering new perspectives on existing data are extremely valuable to businesses.
The Google Analytics Benchmarking reports are one such tool. By providing aggregated industry data alongside your web property’s own data, the Benchmarking reports offer new data and new perspectives on what you already have.
In this article, I’ll explain what the Benchmarking reports are, why you should care about them, and how you can use them to improve your business.
What are the Google Analytics Benchmarking reports?
With respect to data, a benchmark is a standard against which other data can be compared.
In its Benchmarking reports, Google Analytics provides these standards in the form of aggregated data from web properties like yours. This data is segmented by industry vertical and amount of daily traffic, so that you can compare your website’s traffic to that of “industry peers.”
The reports have three dimensions- channels, location, and devices- that allow you to compare sessions by channel (organic search, referral, etc.), sessions by country, and sessions by device against your industry benchmark. Along with the sessions count, the reports include basic behavior or engagement metrics- pages per session, average session duration, and bounce rate.
The Google Analytics Channels Benchmarking report
Why you should care about benchmarking
I mentioned above that the Benchmarking reports provide new data and new perspectives on your existing data, both of which can help you improve your web presence. But how does this work? Where do the new perspectives come from, and how do you uncover that valuable new information?
Firstly, it’s important to realize that the Google Analytics Benchmarking reports give your data context that you wouldn’t otherwise have.
For example, whereas your regular Analytics reports could tell you that you received 10,000 visitors from organic search traffic in the past month, the Benchmarking reports could tell you that this was way more organic search traffic than was received by similarly-sized sites in your industry. Similarly, your regular Analytics reports could show you that visitors on mobile devices averaged 1.2 pages per visit to your site during the last month, but the benchmarking report could tell you that your industry peers’ mobile traffic averaged 60% more pages per visit to their sites.
This kind of contextualized data provides the new perspectives on your web property’s traffic. The new information comes from what you do with it next: ask “why?”
Why do we get so much organic search traffic? Why do our mobile visitors visit fewer pages than our competitors’ mobile visitors?
Asking and answering these questions will drive to the core of your web strategy, uncovering new information that can lead to major improvements in your web presence. And you probably wouldn’t have asked them if it weren’t for the benchmarking report!
Figure out where you stand and where you're going with @GoogleAnalytics Benchmarking
How to use the Benchmarking reports to get new information (with real examples)
Setup
To get started with the Benchmarking reports, which you can find under the Audience reports, you’ll need to have data sharing enabled on your Analytics property. If you don’t, you’ll see something like this in the Benchmarking reports.
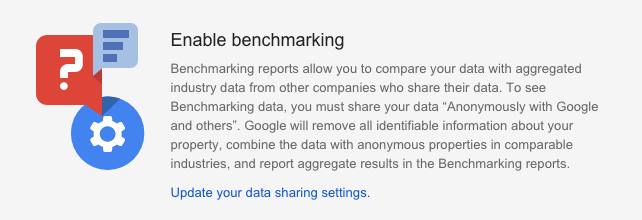
Follow the instructions to update your sharing settings and enable it.
Once your reports are available, the first step is choosing your industry vertical, country, and size. You can find these options in the drop-down menus above the report.
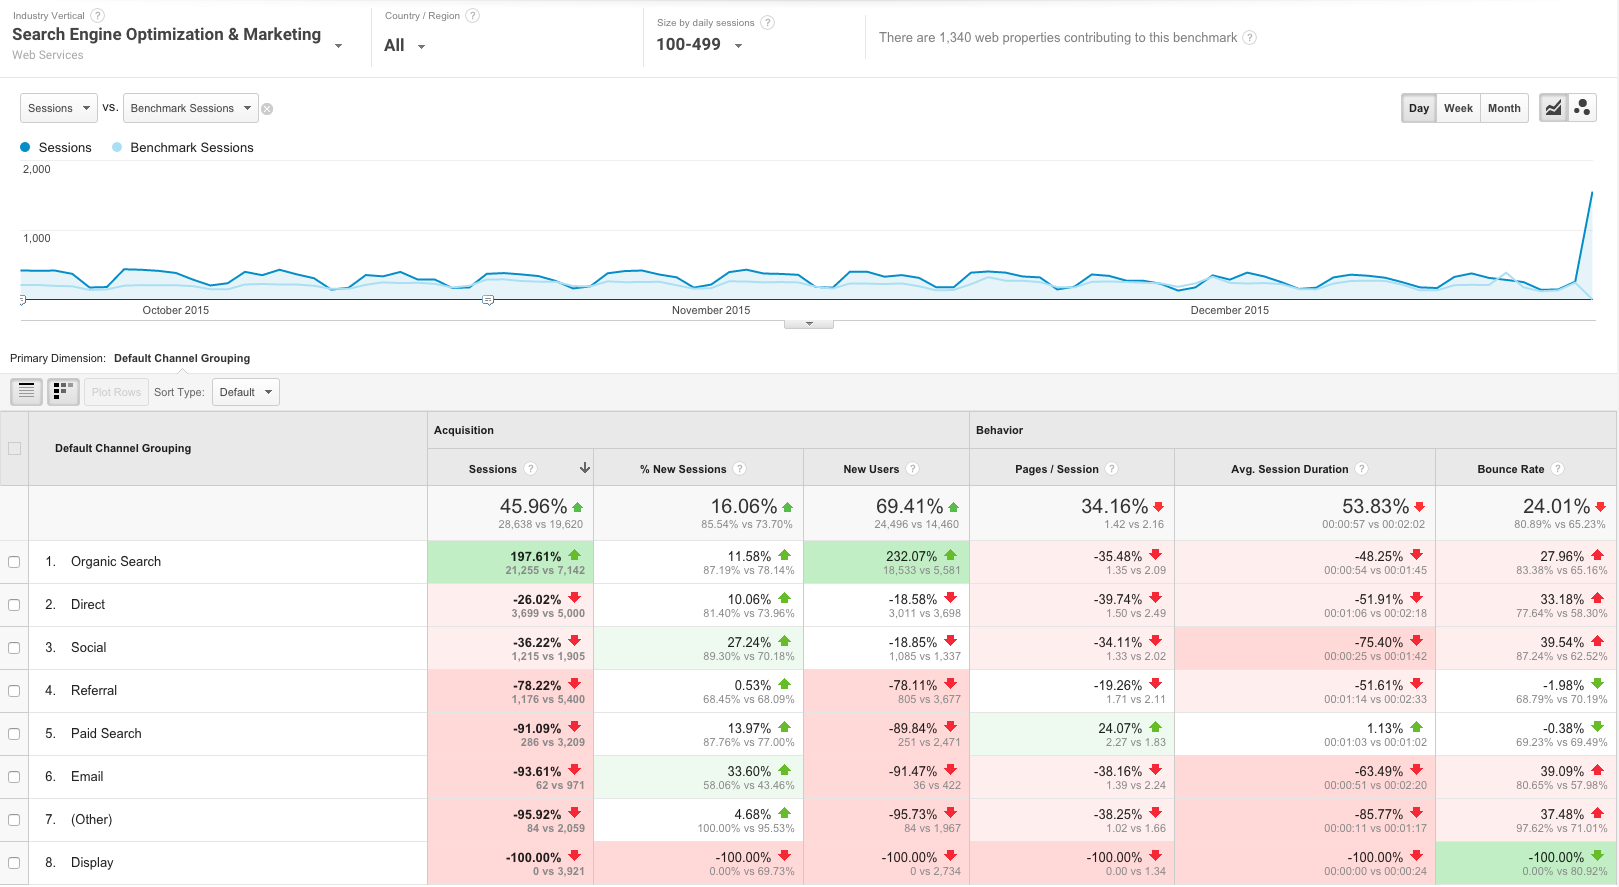
To explore how Brolik stacked up against our industry peers, I chose the Search Engine Optimization & Marketing industry vertical found under Internet & Telecom > Web Services. Search engine optimization and marketing only describe half of our services at Brolik, so I reminded myself to check on the Web Design & Development industry vertical, also under the Web Services category, later.
I wanted to view data for all countries, at least to begin, and for “Size by daily sessions,” I stuck with the 100-499 segment that was pre-set by Analytics.
With these steps completed, you’re ready to review your data and start asking questions.
Viewing the data and asking questions
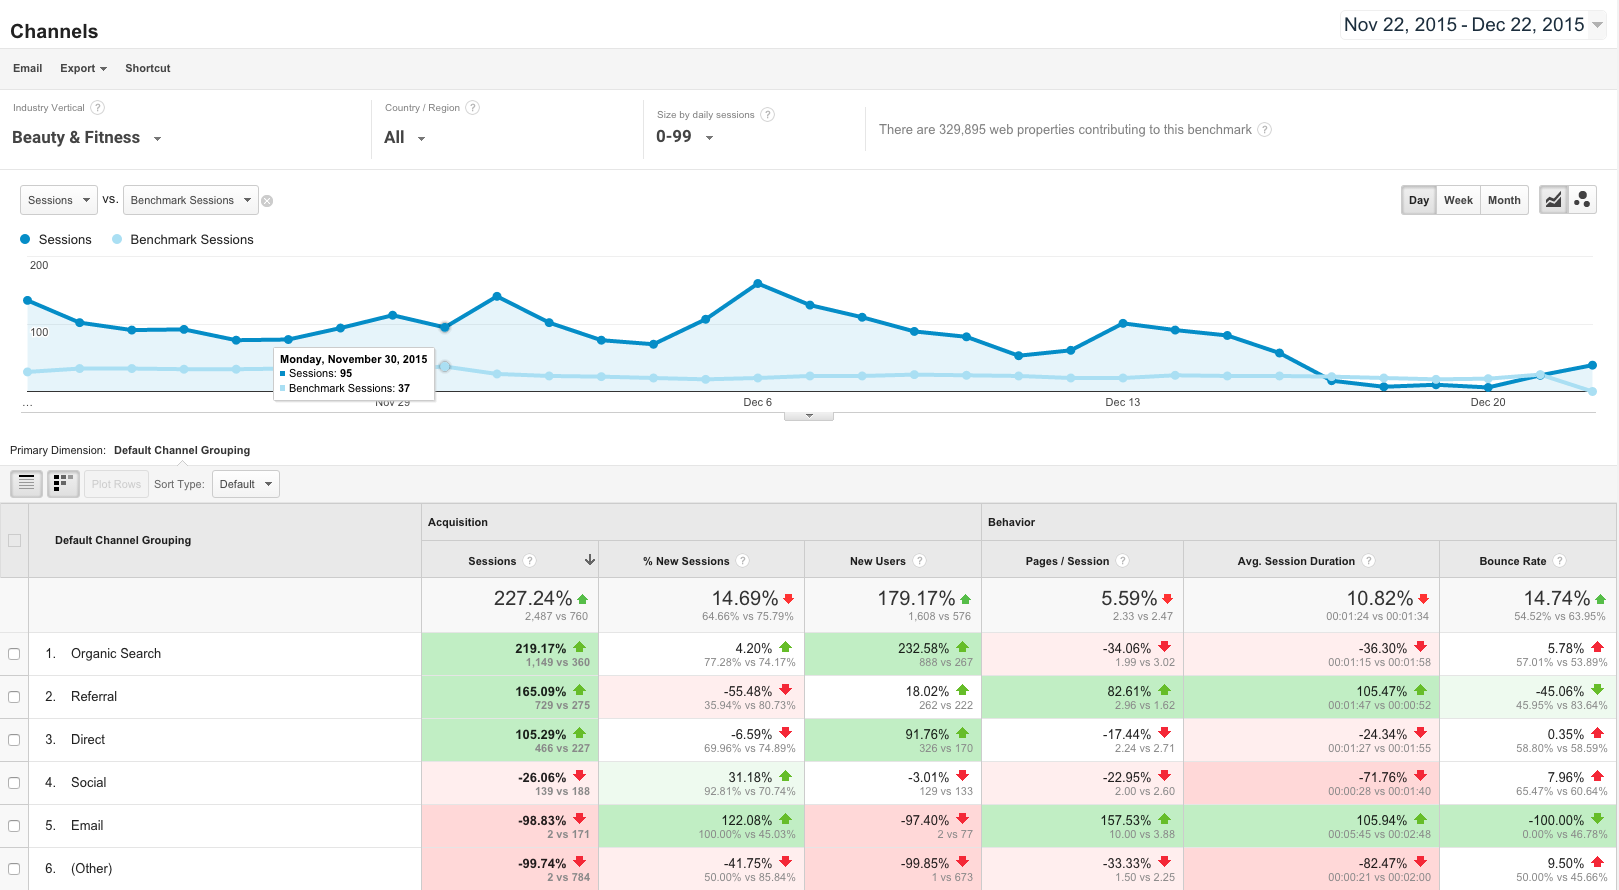
The best way to illustrate the process of asking questions to uncover new information is with an example from our own Channels benchmarking report, pictured below.
Brolik's Google Analytics Channels Benchmarking report
When viewing this report for Brolik, the following questions, in no particular order, arose:
- Why do we focus so much on organic search traffic?
- Why does our organic search traffic have worse engagement metrics than the industry benchmark’s?
- Should we be focusing on this traffic? Does it help us accomplish our business goals?
- We
do a great job of engaging paid search traffic compared to our
competition. Does this engagement translate to goal completions (views
of our “Work” page, calls, etc.)? Why or why not?
- If it does, can we get more of our traffic from this source without sacrificing quality?
- We are especially behind our industry peers when it comes to average session duration, and across all channels. Why?
- Is our navigation not as good as our industry peers’? Is our content not as engaging?
- Why are our email readers so much more likely to be new users than our competitors’ email readers?
- I know that we don’t send out emails very often…
- Do our email readers only visit our site when we send them an email? Alternatively, do our emails get shared more than competitors’?
- How often is the sales team sending emails to people that they meet in person?
- How reliable is Google Analytics’ email attribution in the first place?
- I know that we don’t send out emails very often…
- Why
does our paid search traffic view 24% more pages than the
competition’s, but only stay on our site 1 second longer than the
competition’s?
- What pages does our paid search traffic view, and how do they interact with them?
Answering your questions
Of course, your job isn’t done as soon as you ask questions. Answering the questions is what will provide you with the new information that will help you improve your web presence.
This process requires research and, in many cases, a multidisciplinary collection of skills, ranging from analytics to web design. You may find that answering your questions is more difficult than you anticipated. You may find that you need help from your coworkers, or friends from outside of your organization. However, if it helps you clarify your business’ strategy for each marketing channel, improve your site’s user experience, send better emails, or guide your business’ strategy in any of the numerous possible ways, the chances are that it will be worth it.